

Logistic Regression Model using Python
Some of the procedures involved in machine learning are to reduce the values in the columns, without losing the actual information.
What is logistic regression? And how is it helpful?
From sklearn import preprocessing
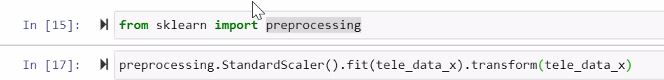
If we want to do a computation for big numbers, it would be hard for RAM to execute. Hence we would try to reduce the big numbers of all the Columns. Finally bring all the columns to the similar range for better calculation purposes.

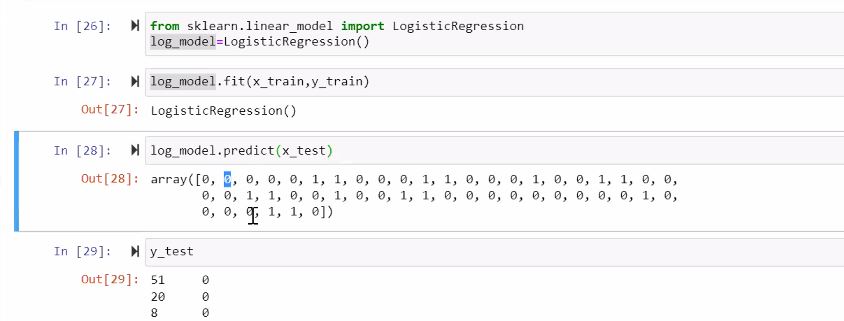
from sklearn.linear_model import LogisticRegression
log_model=LogisticRegression()
#Train the historical data using the fit method
log_model.fit(x_train,y_train)
The logistic model has been created. We need to evaluate the model now. First we need to predict with the test data.
Here, RMSE is not the right metric to check if the model is good or bad. For any categorical data like arranged in [0,0,1,1,0], it is not the correct way to check if it's a good or bad model.
Let's build a model that if there is any obstacle for a car, whether to apply brakes or not?
|
y |
y^ |
|
|
Yes |
Yes |
+ |
|
Yes |
No |
- |
|
No |
Yes |
- |
|
No |
No |
+ |
P = Cases being + / Total Cases
Confusion Matrix as per the above table:
Actual values:
|
|
Yes |
No |
|
Yes |
1 |
2 |
|
No |
3 |
4 |
There are 4 Quadrants in confusion matrix
First Quadrant: True Positive
Second Quadrant: True Negetive
Third Quadrant: False Positive
Fourth Quadrant: False Negetive
The confusion matrix is used to see the accuracy in our predicted model.
Also, accuracy is not the only metric to calculate every problem.
Based on the business scenarios we will be deciding the other metrics too. There will be cases where you need to consider multiple quadrants, which is the combination of recall and precision.
Comments
0